**This is for informational purposes only and not a recommendation to Buy or Sell E-mini or any other investment vehicle**
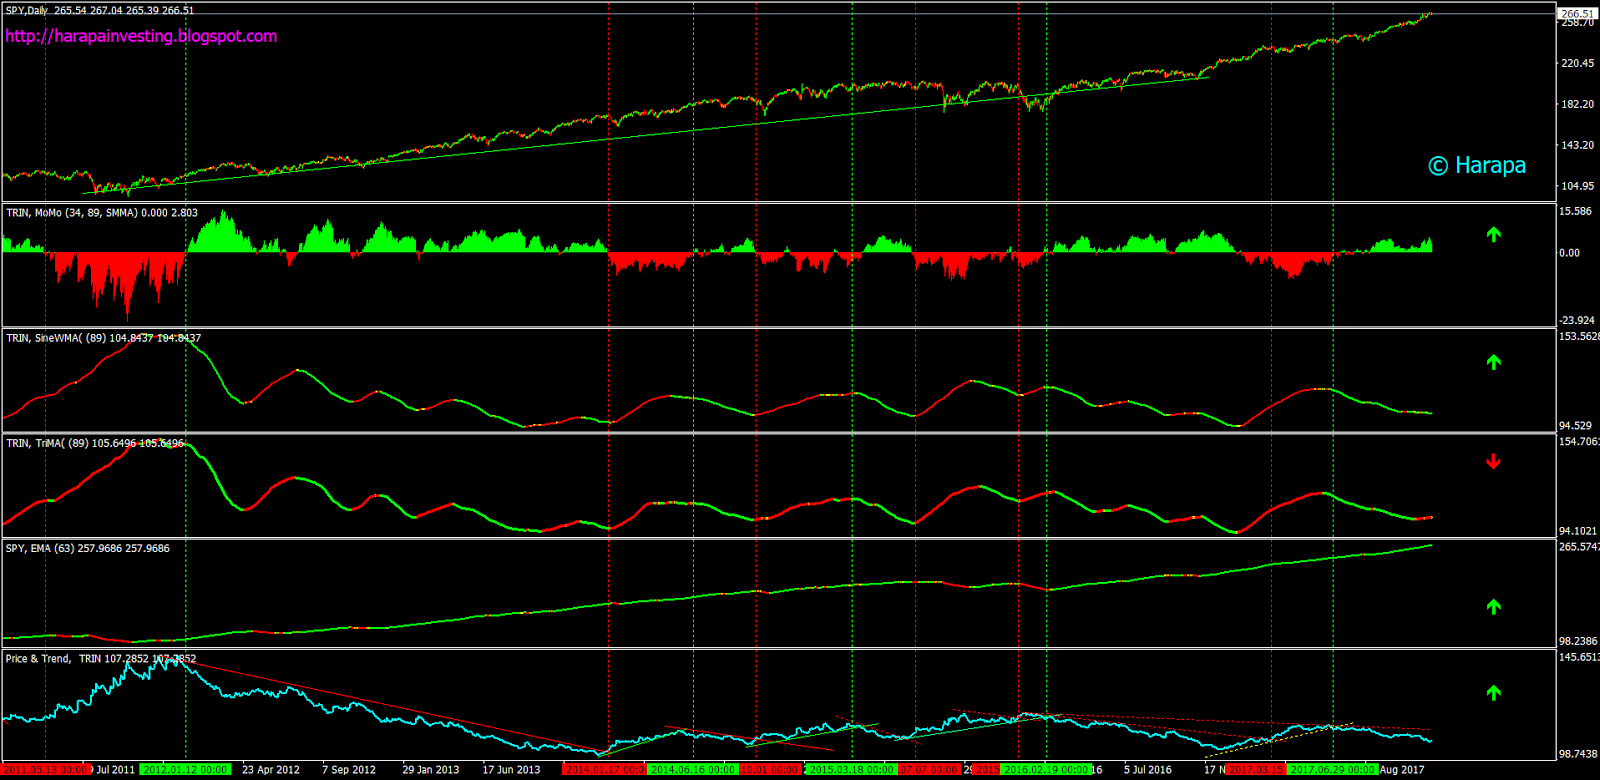
TRIN is a widely followed breadth measure of US stock market. However, its erratic nature makes it difficult to use as a measure to time the US equities in the short or long run. This limitation, however, is resolved by the application of few less conventional smoothing measures. The enclosed charts show the fidelity of application of these smoothing measures in predicting market turning point both in recent and distant times, including the infamous crash of '87. In these charts green color of an indicator is considered equity bullish and red as bearish.
Currently this setup is in Buy mode. Equities usually don't do well when this setup is in Sell mode. On the charts below green and red vertical lines indicate buy/sell points for SPY.
Technical Details:
MoMo is a plot of 34 minus 89 periods Smoothed Moving Average of 1/TRIN (Inverted TRIN)
SineWMA, 89 periods Sine-Wave Moving Average of TRIN
TriMA, 89 periods Triangular Moving Average of TRIN
Present
(as of close of October 18, 2019)


2008-2016
 2006-2009
 2002-2006
 1997-2002


1987-1990

thanks 4 sharing,
ReplyDeletegis
This looks very useful, thanks. What are the indicators you are running? I see the name MoMo, for instance, but I don't know what that means. It looks like it might be a MACD-style moving average difference? I assume SineWMA and TriWMA are both weighted moving averages?
ReplyDeleteThanks again...
MoMo is a plot of difference of 34 and 89 period smoothed moving average. The other two plots are moving average of TRIN of types indicated; Triangular MA and Sine wave MA. You can see brief description of these here. http://www.mbtrading.com/help/navpro/Simple_and_Exponential_Moving_Average.htm
DeleteNice website. I look for rational traders because they do very well and you seem to be one of them.
ReplyDelete1. What software do you use to draw these charts?
2. How do you draw the vertical bars?
Thanks for your interest in my research.
ReplyDelete1. MetaTrader 4.0 (a free but professional grade software, http://www.metatrader4.com/traders)
2. V. Bars are drawn manually at points when all three indicators change direction (green line = indicators changing to green from red).
Thank you for such a fantastic blog. Where else could anyone get that kind of info written in such a perfect way? I have a presentation that I am presently working on, and I have been on the lookout for such information. Stock Market Tips
ReplyDeleteGreat explanation about this topic and i am new guy to this job thanks to sharing the wonderful articles.This is an interesting post. It is also a helpful resource. Great topic, thanks for taking such good care of this website!
ReplyDeleteVery informative blog. Have enjoyed looking through it over the last several days.
ReplyDeleteMany thanks for share you ideas. Please be so kind to show us periods for trin method for:
ReplyDelete1-2002 to 2007
2-june 2007 to 2009.
Brds
Appended...
DeleteOne purpose of giving away the technical details of the setup is to allow user to replicate the setup at their own for further study.