Disclaimer

This blog is for educational purposes only

Thursday, July 11, 2013

Watch this as SPY Makes New All Time Highs

Watch this setup as SPY makes new all time highs for signs of impending correction

SP500 correcting from all time high, Breadth not favorable. NYSI < 500, means last all time high is at risk.
(Chart updated after the close of January 07,  2022)
 I plan to manage my longs using my short term trading setup. You can mange yours by using a trend line. The green trend line is more important than you may think. Remain long as long as price is above the green trend line, quite when it breaks.


*Why NYSI must rise to 500? See here:
http://www.mcoscillator.com/learning_center/weekly_chart/summation_indexs_magic_tricks/

Saturday, March 30, 2013

TRIN as a Predictor of Stock Market Direction

  **This is for informational purposes only and not a recommendation to Buy or Sell E-mini or any other investment vehicle**

TRIN is a widely followed breadth measure of US stock market. However, its erratic nature makes it difficult to use as a measure to time the US equities in the short or long run. This  limitation, however, is resolved by the application of few less conventional smoothing measures. The enclosed charts show the fidelity of application of these smoothing measures in predicting market turning point both in recent and distant times, including the infamous crash of '87. In these charts green color of an indicator is considered equity bullish and red as bearish.

Currently this setup is in Buy mode. Equities usually don't do well when this setup is in Sell mode. On the charts below green and red vertical lines indicate buy/sell points for SPY.

Technical Details:
MoMo is a plot of 34 minus 89 periods Smoothed Moving Average of 1/TRIN (Inverted TRIN)
SineWMA, 89 periods Sine-Wave Moving Average of TRIN
TriMA, 89 periods Triangular Moving Average of TRIN

  Present
(as of close of October 18, 2019)


2008-2016
2006-2009
2002-2006
 1997-2002
1987-1990

Saturday, March 23, 2013

Momentum Meter: A Tool to Predict the Direction of Next Move in E-Mini/SPX

Can momentum be used to predict the short term direction of the market? This setup says, yes.

To understand this setup please first read this .

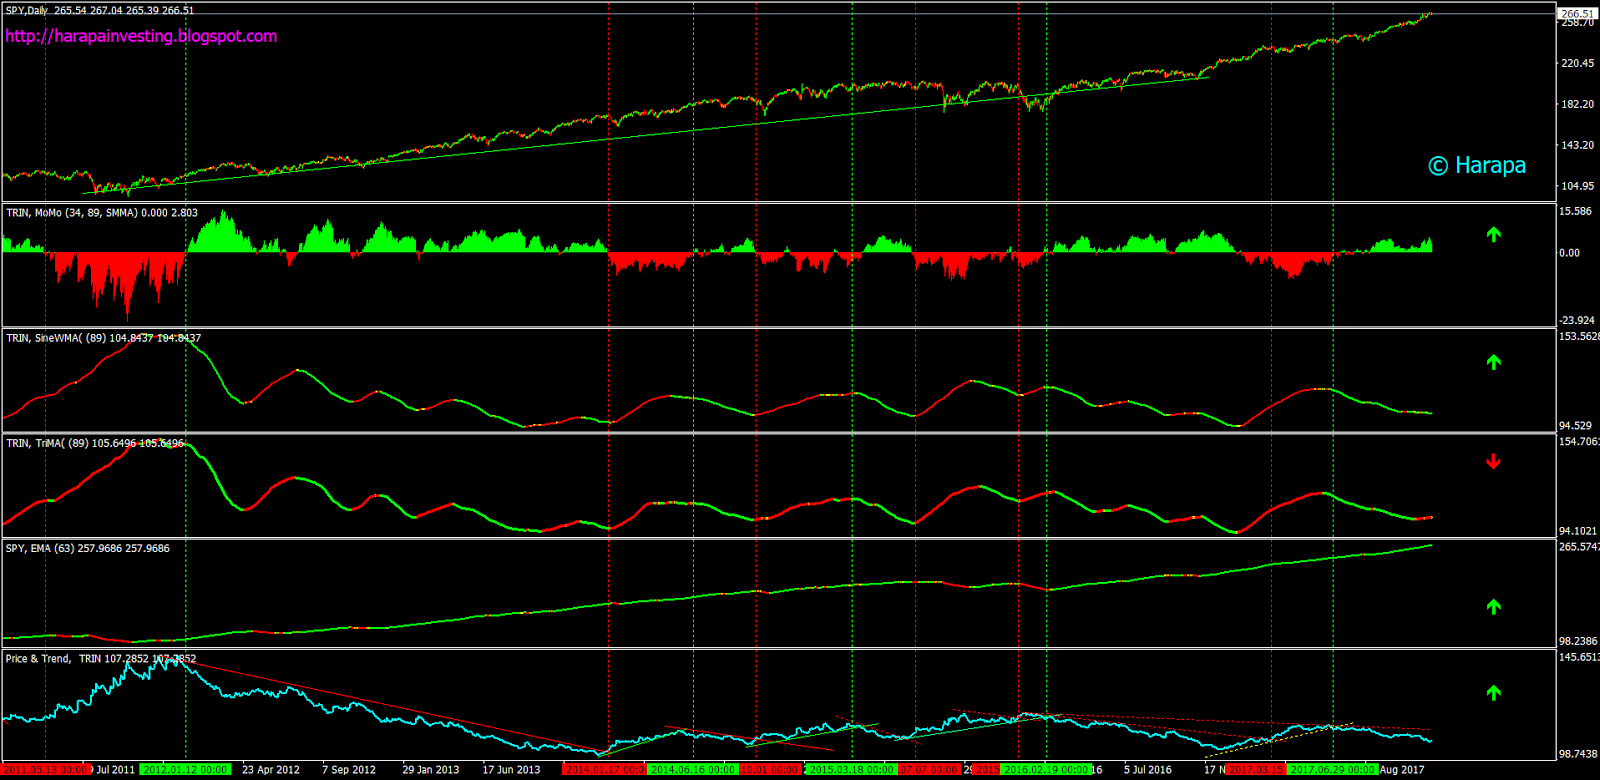
"Momentum Meter" is an indicator that displays momentum in select instrumentsa. listed on my Momentum Block. The indicator displays momentum in Equities & VIX futures, and currency markets using hourly bars. A value of +3 and above coincides with gains in  E-mini, while a value of -3 or less with losses. Following panels show how this indicator helped to capture major down falls in each of last three years, including the infamous flash crash of 2010, and water fall decline of 2011.

As this setup has the tendency to repaint last few bars real time signal may get adjusted after the initial trigger. This problem may result in adjustment of initial signal by +/- few hours normally but can be up to several hours. Why several hours? Because one of the element of this setup is Volatility Futures which only trade during CBOE open hours. So if the signal from volatility is adjusted to prior day close, it will reslus in revision of Momentum Meter reading since last day's close.


ES points gained after "Momentum Meter" rises to +5, 2nd time when in long trade.
Since 1/1/2010, Meter reached +50 levels while system was in long trade 10 times. Afterward system logged an average of 42.3 ES points before exiting the trade (meter dropping to -30).

A trading strategy that took a long position in E-mini when indicator reached +30 from being below and flipping to short side when indicator drops to -30, with a 2% stop loss could have made a fortune as shown in the table belowb. Please note the profits are based on gains in ES points.


If you find this stuff enticing, please familiarize yourself with the setup as I plan to make this setup a regular part of my "Morning  Take".


a. Method to compile the list is described in item #8-11 here.
b. Past performance is no guarantee of the future.