Disclaimer

This blog is for educational purposes only

Saturday, March 30, 2013

TRIN as a Predictor of Stock Market Direction

  **This is for informational purposes only and not a recommendation to Buy or Sell E-mini or any other investment vehicle**

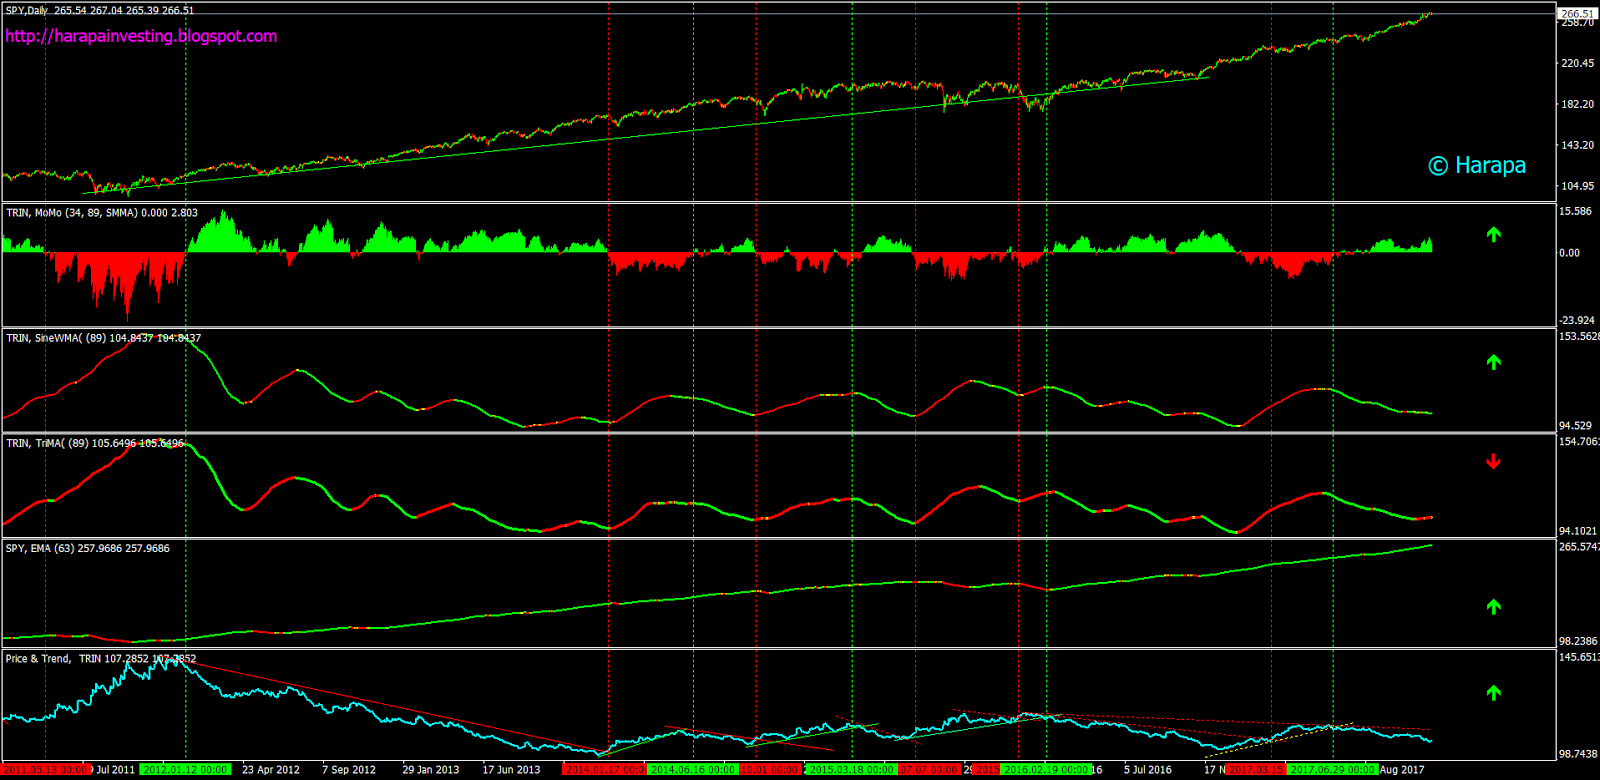
TRIN is a widely followed breadth measure of US stock market. However, its erratic nature makes it difficult to use as a measure to time the US equities in the short or long run. This  limitation, however, is resolved by the application of few less conventional smoothing measures. The enclosed charts show the fidelity of application of these smoothing measures in predicting market turning point both in recent and distant times, including the infamous crash of '87. In these charts green color of an indicator is considered equity bullish and red as bearish.

Currently this setup is in Buy mode. Equities usually don't do well when this setup is in Sell mode. On the charts below green and red vertical lines indicate buy/sell points for SPY.

Technical Details:
MoMo is a plot of 34 minus 89 periods Smoothed Moving Average of 1/TRIN (Inverted TRIN)
SineWMA, 89 periods Sine-Wave Moving Average of TRIN
TriMA, 89 periods Triangular Moving Average of TRIN

  Present
(as of close of October 18, 2019)


2008-2016
2006-2009
2002-2006
 1997-2002
1987-1990

Saturday, March 23, 2013

Momentum Meter: A Tool to Predict the Direction of Next Move in E-Mini/SPX

Can momentum be used to predict the short term direction of the market? This setup says, yes.

To understand this setup please first read this .

"Momentum Meter" is an indicator that displays momentum in select instrumentsa. listed on my Momentum Block. The indicator displays momentum in Equities & VIX futures, and currency markets using hourly bars. A value of +3 and above coincides with gains in  E-mini, while a value of -3 or less with losses. Following panels show how this indicator helped to capture major down falls in each of last three years, including the infamous flash crash of 2010, and water fall decline of 2011.

As this setup has the tendency to repaint last few bars real time signal may get adjusted after the initial trigger. This problem may result in adjustment of initial signal by +/- few hours normally but can be up to several hours. Why several hours? Because one of the element of this setup is Volatility Futures which only trade during CBOE open hours. So if the signal from volatility is adjusted to prior day close, it will reslus in revision of Momentum Meter reading since last day's close.


ES points gained after "Momentum Meter" rises to +5, 2nd time when in long trade.
Since 1/1/2010, Meter reached +50 levels while system was in long trade 10 times. Afterward system logged an average of 42.3 ES points before exiting the trade (meter dropping to -30).

A trading strategy that took a long position in E-mini when indicator reached +30 from being below and flipping to short side when indicator drops to -30, with a 2% stop loss could have made a fortune as shown in the table belowb. Please note the profits are based on gains in ES points.


If you find this stuff enticing, please familiarize yourself with the setup as I plan to make this setup a regular part of my "Morning  Take".


a. Method to compile the list is described in item #8-11 here.
b. Past performance is no guarantee of the future.

Momentum Block:Background

To help you understand the value of information presented as "Momentum Block", I will try to explain it in a question answer form:-

1. What is a Momentum Block?
Momentum block is compendium of list of financial instruments or economic measures with a proven record of predicting the performance of US equities.

2. What makes up the Momentum Block?
The list include equities and equity futures (US and International), volatility indices, currency pairs highly correlated with in SP500, and indicators of economic.business conditions in the US. These instruments are listed below. Note, signal status is shown for illustrative purposes only.


3. Why do you call it Momentum Block ?
Because each vehicle on the list is assigned a buy or sell using momentum type indicators.

4. Why momentum?
It is an easily measured characteristic.

5. How do you measure momentum?
I use RSI of multiple moving averages and Heiken Hashi Bar assignment to measure momentum or sometime a commodity channel index based indicator.

6. How do you assign buy or sell?.
A buy is assigned when both MA ribbon and Heiken-Ashi bar for the price of instrument are white (indicating a positive momentum) and RSI of 13 period MA of the price is above 65.
A sell is assigned when both MA ribbon and Heiken-Ashi bar are red (indicating a negative momentum), and RSI of 13 period MA is below 35.
It is just as simple as this. I use only this method for all vehicles and for all time frames.
Note that this setup tends to repaint last few bars, especially after a fast move.

7. This setup is an adaptation of  The 80'S Forex System, and RSI of MA


8. Why do you use hourly and daily setup?
The hourly setup is more responsive than daily. I use hourly for immediate trading and daily to gauge the strength of the move.

9. How can I use this information?
This table is like taking a pulse. I look at it before markets open in US. It gives me a pretty good indication of what is to come.

10. Can you elaborate on "What is to come?", 
Looking back to 2007, I noted that prior to almost all moves of  > 5%  a subset of instruments on the list was either in buy or sell mode when viewed on daily charts. I have created a composite indicator based on these 5 instruments, named it "Momentum Meter"

11. Which instruments are used to construct the Momentum Indicator?
Instruments used to create the Momentum Indicator are determined dynamically. The final list includes one member each from US Equity and Volatility Indices, and three from the currency group. The composition is derived (on last weekend of each month.) by looking at the performance of various combinations during the prior 26 weeks. The best performing group is than used to calculate the Momentum Meter until the next month.

I hope the above information will help you understand the thinking behind creation of "Momentum Block"


Sunday, March 17, 2013

Monopoly


  **This is for informational purposes only and not a recommendation to Buy or Sell stocks or any other investment vehicles**
SP500 is very close to an all time high and many other indices at similar levels. “Is this going to be the top for the Bull Run that began in March 2009?" is a question on most investor's mind. This weekend, I spent a lot of time pondering on the above question. The fact that both my short term and long term models are in sell  mode tells me that the stock prices are not likely to move higher in the coming days.

While these models have helped me to stay on the right side of the market in the last few years, these don't have long enough history to study their behavior during the major market tops of the last 25 years a. This problem, however, is solved if I look at my Monopoly setup. This setup is a disaster protection plan for my portfolio. The setup avoided the crash of ’87, 2000-02 bear market, and major corrections in '1990, '1998, and 2011 (see charts below to appreciate the calls made by this setup).

Just like any time based indicator, Monopoly can be derived in short, medium or long term versions by simply adjusting the time period. Its medium term version, coupled with a slope function, seems to provide very timely signals. Note how the setup moved to sell side before all major turning points mentioned above. Also, in studying its behavior near the tops, I noted that the setup issues 2 sell signals near the market top, and it’s the second signal that coincides with the real market top.

Before I conclude, let me make this clear that Monopoly is an independent thinker, i.e. it is derived by an algo that is not represented in any other model shown on this site.

Currently Monopoly is in "Long SPY" Mode
If you like Monopoly or other models I have, please bookmark this page for future visits.
I update my models regularly; you don't want to miss if and when these issue a signal.
 
Current view (as of September 25, 2023)
1987 & 1990
`1998 & 2000
2007
                                                                        2018-2020

 
Performance of Monopoly Since 1990
(Last Update January 07, 2020)


a. All my models have at least one base element with 20+ years of profitable history as a standalone input. However, addition of new elements in each model, whenever these became available, has made these even more reliable than before.